PMC’s last blog post focused on public media revenue trends during the Great Recession (December 2007 to June 2009) to help reveal insights that may be relevant to the current COVID-19 crisis. In this post, we explore the relative successes of public stations since the last recession to discover what further lessons can be learned.
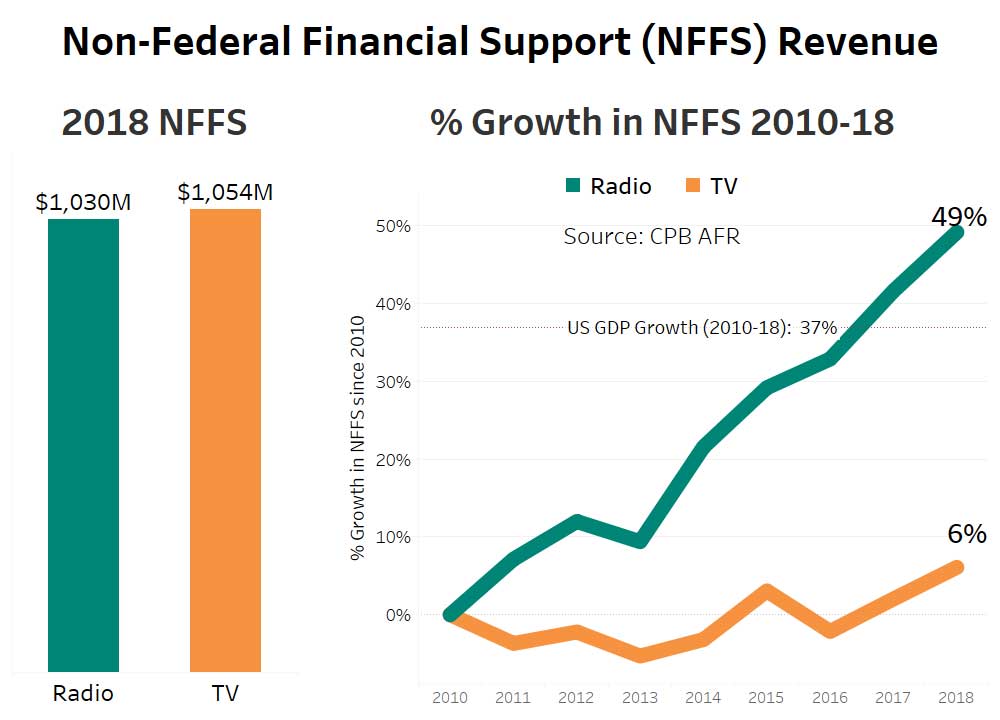
Our analysis has found that public radio has flourished in the post-recession period and that public television has grown at a slower rate. Although public television’s Non-Federal Financial Support (NFFS) revenue remains higher than public radio’s ($1.05 billion versus $1.03 billion in 2018), radio has outgrown TV significantly over the past decade. Public radio station revenue collectively grew by 49% between 2010 and 2018, outgrowing the overall economy (+37%), and considerably outgrowing public television (+6%).
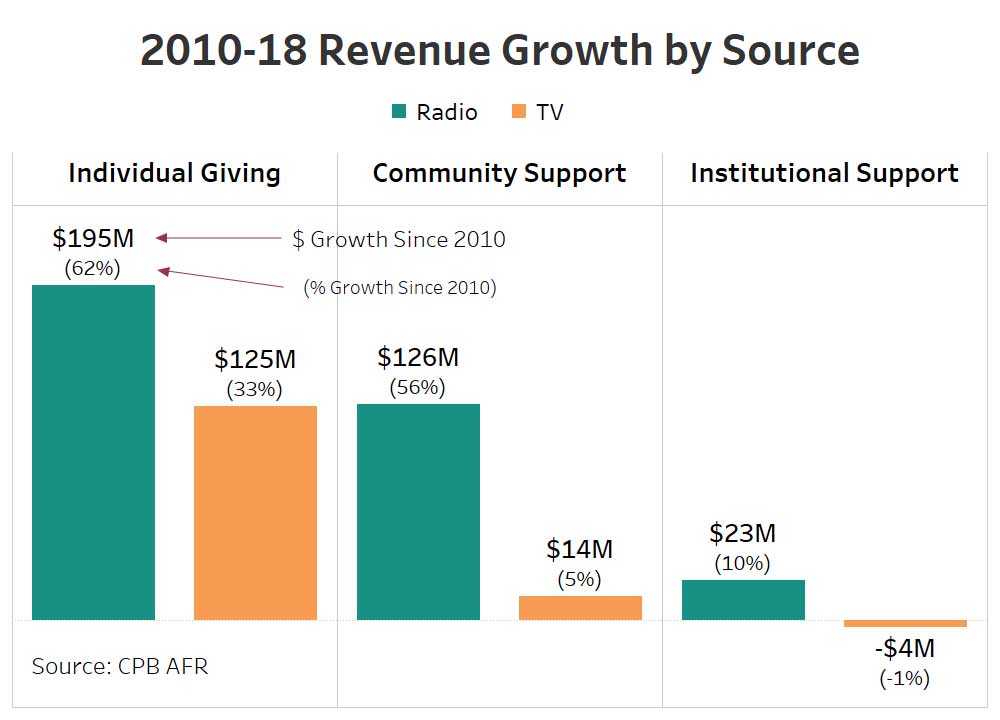
We can understand why when we look at the different sources of revenue. Public radio outgrew public television in individual giving (membership and major gifts), community support (business and foundation revenue), and institutional support (university and local, state, and federal government support) between 2010 and 2018. Although it should be noted that institutional revenue for both radio and TV grew at well below GDP.
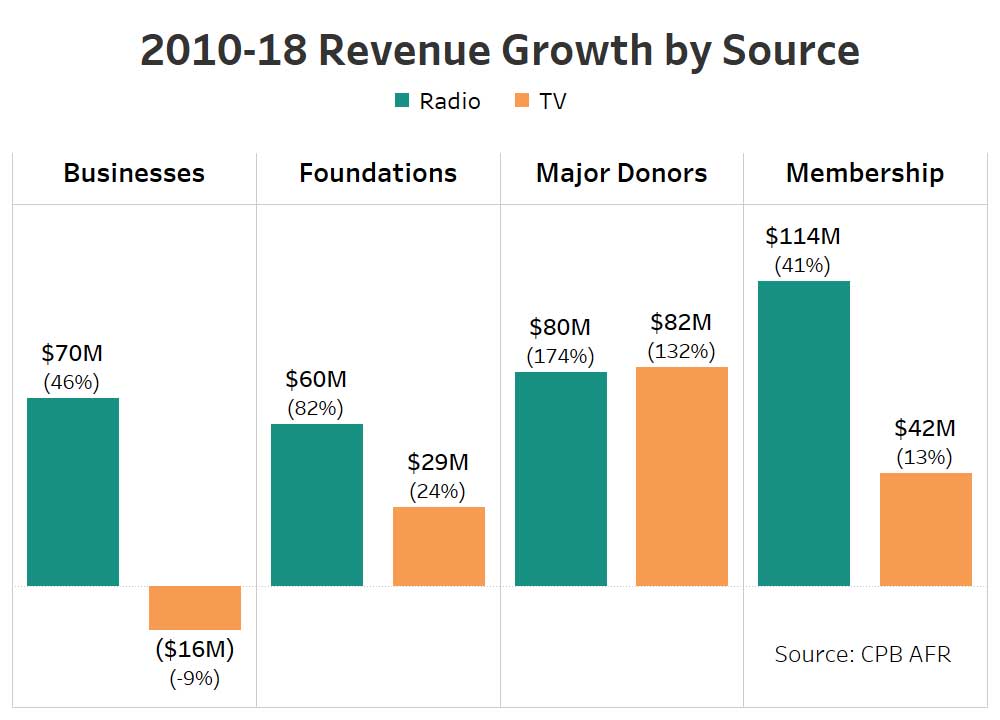
The starkest differences between public radio and television occurred in business and membership revenue. Business revenue for public radio stations increased $70 million (+46%) from 2010 to 2018 whereas business revenue for television stations dropped by $16 million (-9%). Focusing on membership, public radio station revenue grew by $114 million (+41%) and public television trailed behind with $42 million in membership revenue growth (+13%).
However, it was encouraging to see impressive major giving revenue numbers for radio and TV – both station groups increased their revenue from $1,000+ gifts by well over 100% in the post-recession period.
It has been said before, but size really does matter in public media. More specifically, large public radio stations have outgrown all other groups, increasing their NFFS revenue +62% since 2010. This compares with +2% NFFS revenue growth for small public radio stations.
Smaller public television stations have had an even tougher time – NFFS revenue for both medium and small sized public TV stations has contracted since the end of the Great Recession (-3% for medium stations and -11% for small stations). Much of the decline is because of little to no growth in community support and a decline in revenue from institutional sources.

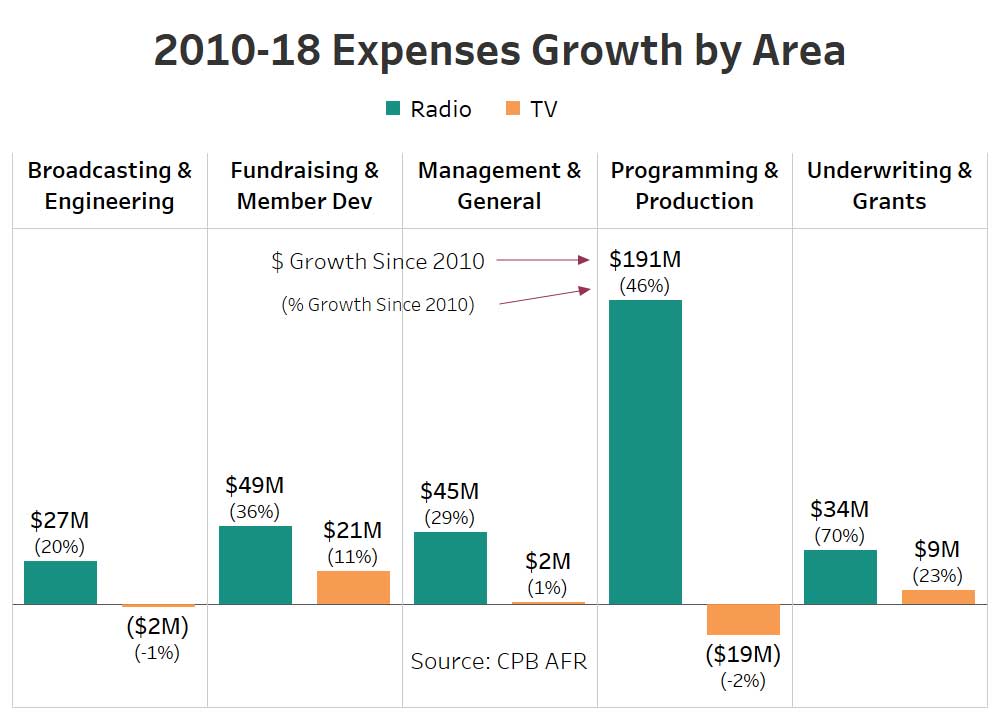
Station investments may help explain the disparate revenue trends between public media groups. Looking at expenses by area, public radio stations increased their investment in programming and production substantially between 2010 and 2018 (+46%) while public TV stations cut content expenses over the same period (-2%). Public radio stations also grew their investments in all other organizational expense categories, including fundraising which grew by $49 million (+36%).
However, as with revenue, there are some big differences based on station size. Large radio stations were able to grow their investments in content and revenue generation at significantly higher levels than their smaller peers. In programming and production, the largest radio stations increased expenses +62% whereas the smallest radio stations increased expenses just +11%. The same story emerges for fundraising expenses, the largest radio stations increased their investment +45% compared with a -2% drop for the smallest radio stations.
The public television trend is more concerning. Most public television stations were unable to grow their investments in critical content and fundraising services in the 2010 to 2018 period (a time when the overall economy grew by 37%).

Analyzing the post-recession data leads us to more questions that are harder to answer. These include:
- Are station investments driving revenue outcomes?
- Why is public radio now outgrowing public television? Was it a conscious change of direction or has the external environment shifted in a way that has provided public radio with an advantage that public television is unable to benefit from?
- Why is station size so important? Did bigger stations emerge from the recession without cutting vital services? Are smaller stations located in less affluent and more rural markets that make fundraising more challenging?
At Public Media Company we are trying to answer challenging questions like these to help strengthen all public media. Through our client work and research, we are dedicated to helping stations and other public media organizations increase their impact and financial sustainability and we will continue to explore the big questions and share our thoughts in future blog posts.
Note on Data:
All charts use Annual Financial Report (AFR) data from the Corporation for Public Broadcasting (CPB) from 2010 to 2018. Early analysis indicates that 2019 data continues the 2010 to 2018 trend but the 2019 dataset remains incomplete and is not used in this article.
When station size is referenced, large TV stations are those with annual revenues above $10 million and large radio stations are those with revenues above $3 million a year. Medium TV stations have revenues in the $5-10 million range and medium radio stations from $1 to $3 million. Small TV stations have annual revenues below $5 million and small radio stations below $1 million.